En:Graphs for Android
| Language EN [[{{#sub:En:Graphs for Android|3|{{#len:En:Graphs for Android}}}}|SK]] | Navigation: | Projects -> Graphs for Android -> GraphDemo |
| Name | GraphLib (info.kiwiki.graphlib) |
| Version | 1 |
| Type | Library |
| Platform | Android |
| Description | Visual graph componnets library |
| Author | Juraj Ďuďák (Redaktor:Juraj) |
| Download | graphlib.jar |
Obsah
Library content
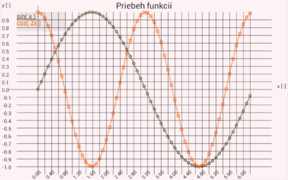
The GraphLib library consists of components for graph visualization on Android platform. There are most knowt type of graphs such as:
- line graph,
- XY graph,
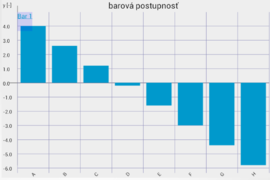
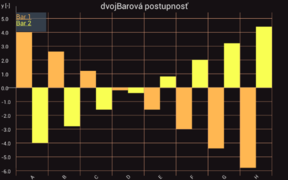
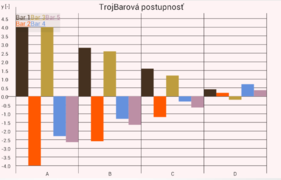
- bar graf,
- table (taxt baset data representation).
Functionality
- Automatic or manual setting of y asis measure
- 4 visual styles (Android, dark, pastel, citrus)
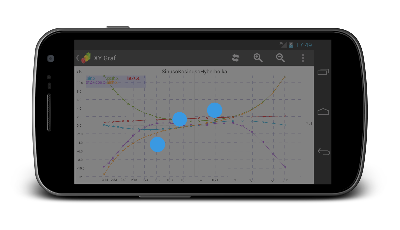
- Zoom-in and zoom-out by well-known gestures (moving 2 fingers)
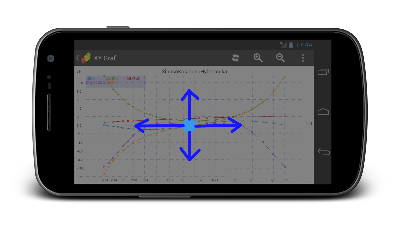
- Move the chart by dragging
- Reset graph settings (zoom, moving) by 3-finger tap
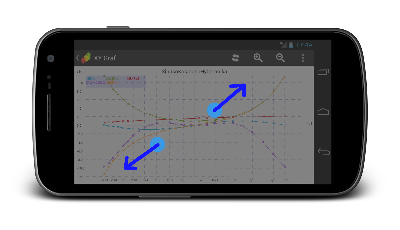
|
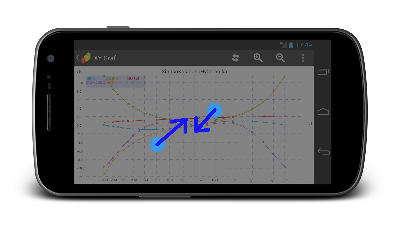
|
| Gesture for zoom-in | Gesture for zoom-out |
|
|
| Gesture for graph reset | Gesture for moving |
Gallery
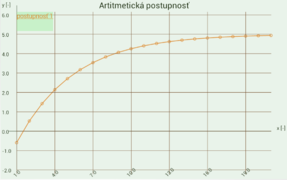
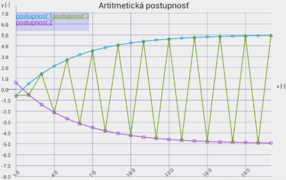
Line graphs
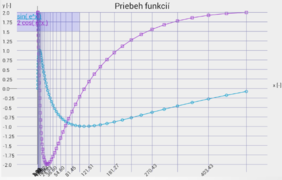
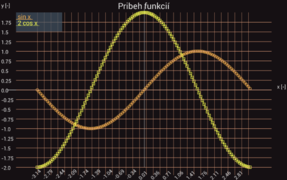
XY Graph
Bar graphs
Detailed description
Platform
- Minimal Android API version : 8 (FroYo)
Common properties of all components:
Every graph consists of title, x and y axis with theit own labels. When representation of multiple data series (2 or more) are color-coded according to the selected visual style. There are 4 themes: Android theme, dark theme, pastel and citrus (green and yellow) theme.
Sample code
    GraphXY graf
    graf = (GraphXY) findViewById(R.id.graphXY1);

    //data sctructure for data representation
    dt=new DataTable();
    // pridanie 1. datovej rady
    dt.addDataSet("teplota");
    dt.addDataY(5);
    dt.addDataY(6);
    dt.addDataY(5);
    dt.addDataY(7);

    //data for x-axis
    dt.addDataX(1);
    dt.addDataX(3);
    dt.addDataX(5);
    dt.addDataX(6);
    dt.addDataX(8);

    //assigment data to graph
    graf.addDataTable(dt);
    graf.setXlabel("Cas [s]");
    graf.setYlabel("Teplota [C]");
    graf.setTitle("Pribeh teploty");
BaseGraph class
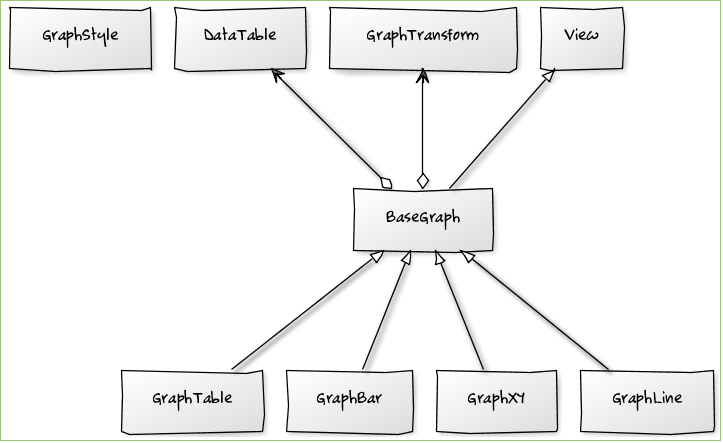
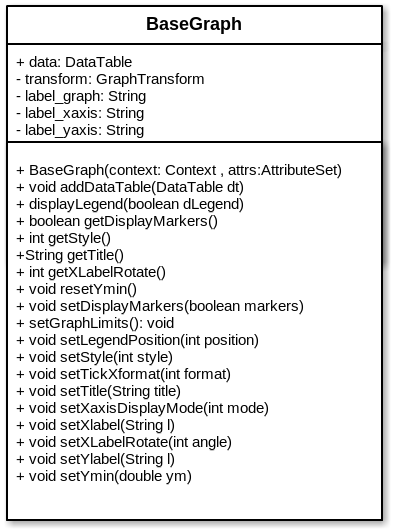
The basic class is BaseGraph that provides work with plotting data, display data conversion defined by scaling and rendering napidsov, axes, labels, axes and legends.
Public objects
- DataTable data
- Object DataTable for representation od displayed data. This object must be used for all types of graphs as data model.
Static constant
- To adjust the display legend (parameter method setLegendPosition)
- BaseGraph.LEGEND_TOP_LEFT
- BaseGraph.LEGEND_TOP_RIGHT
- BaseGraph.LEGEND_MIDDLE_LEFT
- BaseGraph.LEGEND_MIDDLE_RIGHT
- BaseGraph.LEGEND_BOTTOM_LEFT
- BaseGraph.LEGEND_BOTTOM_RIGHT
- To set the display mode X axis ticks
- BaseGraph.XAXIS_DISPLAY_NUM
- BaseGraph.XAXIS_DISPLAY_STR
Public methods
addDataTable - assign table data to be displayed. Object dt (DataTable) must be created and must contain data for display.
public void addDataTable(DataTable dt)
displayLegend - determines whether the display (dLegend = true) or no (dLegend = false) legend
public void displayLegend(boolean dLegend)
getDisplayMarkers - returns information about whether the graph will show signs displayed through points.
public boolean getDisplayMarkers(){
    return this.display_markers;
}
getStyle - Returns the style of the graph as the constant
- GraphStyle.THEME_ANDROID
- GraphStyle.THEME_DARK
- GraphStyle.THEME_PASTEL
- GraphStyle.THEME_CITRUS
public int getStyle(){}
getTitle -Return graph title
public String getTitle()
getXLabelRotate - Returns the rotation labels on the x axis. The resulting value is the angle in degrees and positive rotation is oriented counterclockwise.
public int getXLabelRotate()
resetYmin - Canceled manually setting the lower limit to display the values on the y-axis. After calling this method, the lower limit of the graph on the y-axis is automatically calculated according to the values shown.
public void resetYmin()
setDisplayMarkers - Apply at the line and XY chart. Specifies whether to redraw the curve, respectively. polygon shown signs that point.
public void setDisplayMarkers(boolean markers)
setLegendPosition - Sets the position of the legend. Details of the parameters of the methods are static constants (class MaseGraph)
public void setLegendPosition(int position)
setStyle - set the visual style to view the chart. The possible values of the parameter style are: GraphStyle.THEME_ANDROID, GraphStyle.THEME_DARK, GraphStyle.THEME_PASTEL, GraphStyle.THEME_CITRUS
public void setStyle(int style)
setTickXformat - Sets the number of decimal places to show values on the x-axis.
public void setTickXformat(int format)
setTitle - set the graph title.
public void setTitle(String title)
setXaxisDisplayMode - Sets the way for displaying the values on the x axis. When adding values to the x-axis to the DataTable object, you can add in addition to the numerical value of a text description. This is particularly useful in a bar graph. If this fails to textual value and a text description of the value is the same as the value.
When the parameter BaseGraph.XAXIS_DISPLAY_NUM is used, on the x-axis will be display numerical values. For the constants BaseGraph.XAXIS_DISPLAY_STR alternative text will be displayed.
public void setXaxisDisplayMode(int mode)
setXlabel - sets the name of the x-axis.
public void setXlabel(String l)
setXLabelRotate - sets the angle of x-axis ticks. The default value is 0 Angle increases counterclockwise.
public void setXLabelRotate(int angle)
setYlabel - sets the name of the y-axis.
public void setYlabel(String l)
Class GraphStyle
GraphStyle Class is a class of constants (final) and define the colors for each style. Class includes 4 basic styles to view graphs: GraphStyle.THEME_ANDROID, GraphStyle.THEME_DARK, GraphStyle.THEME_PASTEL and GraphStyle.THEME_CISTRUS
ANDROID theme
| Background | |
| 1. data series | |
| 2. data series | |
| 3. data series | |
| 4. data series | |
| 5. data series |
DARK theme
| Background | |
| 1. data series | |
| 2. data series | |
| 3. data series | |
| 4. data series | |
| 5. data series |
PASTEL theme
| Background | |
| 1. data series | |
| 2. data series | |
| 3. data series | |
| 4. data series | |
| 5. data series |
CITRUS theme
| Background | |
| 1. data series | |
| 2. data series | |
| 3. data series | |
| 4. data series | |
| 5. data series |
