Graphs for Android:GraphXY
Skočit na navigaci
Skočit na vyhledávání
| Jazyk EN SK | Navigácia | Android projekty -> Graphs for Android -> Graphs for Android:GraphXY -> GraphDemo |
Opis
- Názov triedy
- info.kiwiki.GraphXY
GraphXY je graf, v ktorom sa zobrazovaný bod určí súradnicami [x,y]. Pre správne zobrazenie grafu treba naplniť dátovú štruktúru DataTable. Využitie tohoto grafu: pre znázornenie funkčných závislostí.
Prednastavené hodnoty komponentu
- na osi x sa zobrazujú číselné hodnoty (nie textové ekvivalenty)
- názov grafu je "Graf XY"
- Na osi x sa čísla zobrazujú na 2 desatinné miesta
Príklad použitia
...
    <info.kiwiki.graphlib.GraphXY
        android:id="@+id/graphXY1"
        android:layout_width="match_parent"
        android:layout_height="match_parent"
        android:layout_margin="8dp" />
...
public void onCreate(Bundle savedInstanceState) {
   super.onCreate(savedInstanceState);
   setContentView(R.layout.activity_xygraf);
   GraphXY graf;
   DataTable dt;

   graf = (GraphXY) findViewById(R.id.graphXY1);
   dt=new DataTable();
   dt.addDataSet("sin x");
   dt.addDataSet("2cos x");
   for(double x=0 ; x<=2*Math.PI ; x+=0.1){
      dt.addDataX(Math.exp(x));
      dt.addDataY(0, Math.sin(x));
      dt.addDataY(1, 2*Math.cos(x));
   }
   graf.setTickXformat(1);
   this.graf.addDataTable(dt);
   this.graf.setStyle(GraphStyle.THEME_ANDROID);
   this.graf.displayLegend(true);
   this.graf.setLegendPosition(BaseGraph.LEGEND_TOP_LEFT);
   this.graf.setXlabel("e^x");
   this.graf.setYlabel("y");
   this.graf.setTitle("Priebeh funkcií");
}
Náhľady

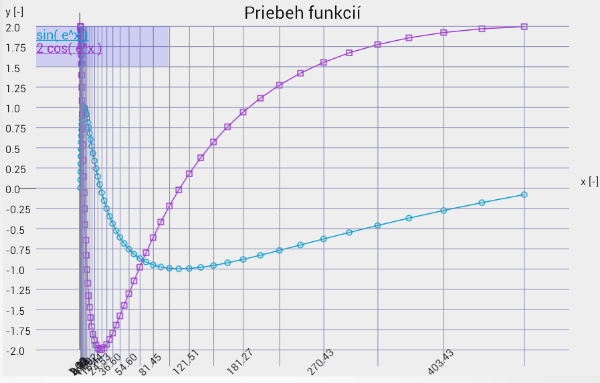
t=e^x, y1=sin(t), y2=2cos(t), android téma

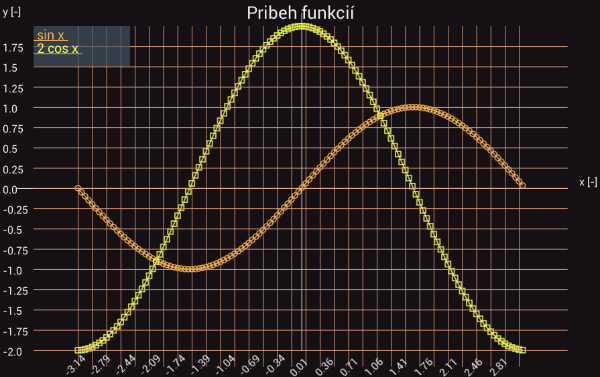
y1=sin(x), y2=2cos(x), tmavá téma

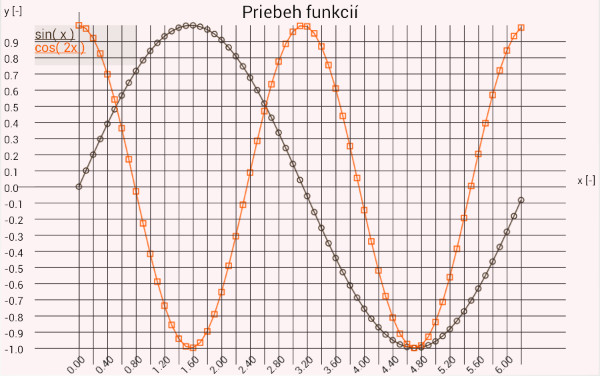
y1=sin(x), y2=cos(2x), pastelová téma

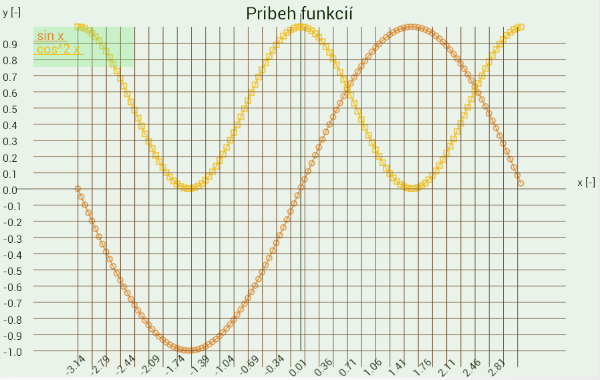
y1=sin(x), y2=cos^2(x), citrusová téma