Graphs for Android:GraphTable
Skočit na navigaci
Skočit na vyhledávání
| Jazyk EN SK | Navigácia | Android projekty -> Graphs for Android -> Graphs for Android:GraphTable -> GraphDemo |
Opis
- Názov triedy
- info.kiwiki.GraphTable
GraphTable zobrzenie grafu vo forme tabuľky, kde prvý stĺpec reprezentuje hodnoty na osi x a ostatné stĺpce reprezentujú jednotlivá dátové rady.
Prednastavené hodnoty komponentu
- názov grafu je "Graf Table"
- legenda sa nezobrazuje
Príklad použitia
...
    <info.kiwiki.graphlib.GraphTable
        android:id="@+id/graphXY1"
        android:layout_width="match_parent"
        android:layout_height="match_parent"
        android:layout_margin="8dp" />
...
import info.kiwiki.graphlib.DataTable;
import info.kiwiki.graphlib.GraphTable;
//...
public void onCreate(Bundle savedInstanceState) {
super.onCreate(savedInstanceState);
setContentView(R.layout.activity_xygraf);
GraphTable graf;
DataTable dt;
graf = (GraphTable) findViewById(R.id.graphXY1);
dt=new DataTable();
dt.addDataSet("x+ sin x");
dt.addDataSet("cos x");
for(double x=0 ; x<=2*Math.PI ; x+=0.1){
dt.addDataX(x);
dt.addDataY(0, x+Math.sin(x));
dt.addDataY(1, Math.cos(x));
}
this.graf.addDataTable(dt);
this.graf.setStyle(GraphStyle.THEME_PASTEL);
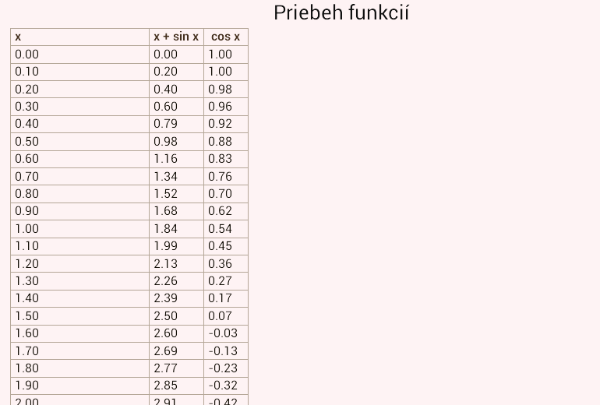
this.graf.setTitle("Priebeh funkcií");
}
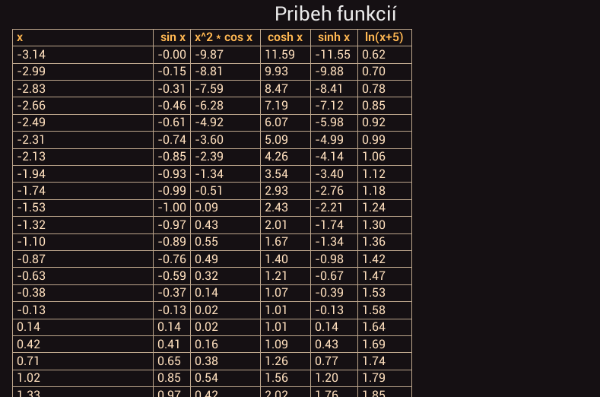
Náhľady

Tabuľka 1, pastelová téma

Tabuľka 2, tmavá téma