Gsim-Plot 4Y: Rozdiel medzi revíziami
Skočit na navigaci
Skočit na vyhledávání
(Vytvorená stránka „__NOTOC__ Category:Simulácie a modelovanie {| border="0" |-valign="top" | {| width=200 border="0" | <center>File:plot_4y.png </center> |} || {| | width=45…“) |
|||
| Riadok 26: | Riadok 26: | ||
'''Summary''' | '''Summary''' | ||
| + | |||
| + | |||
| + | '''Summary''' | ||
| + | |||
| + | {|class="wikitable" | ||
| + | | width=100 | '''Name''' | ||
| + | | width=570 | SPICE/XSPICE 4 Channel Scope Plot | ||
| + | |- | ||
| + | | '''Device''' | ||
| + | |SPICE | ||
| + | |- | ||
| + | | '''Value''' | ||
| + | | PLOT_4Y | ||
| + | |- | ||
| + | | '''File''' | ||
| + | | | ||
| + | |- | ||
| + | | '''Function''' | ||
| + | | Graf 4 časových priebehov | ||
| + | |- | ||
| + | | '''Version''' | ||
| + | | 0.1/A | ||
| + | |- | ||
| + | |} | ||
| + | |||
| + | ''' Attribute list ''' | ||
| + | |||
| + | {| class="wikitable" | ||
| + | ! width="100" | Name | ||
| + | ! width="350" | Value | ||
| + | ! width="50" | Visible | ||
| + | ! width="150" | Show | ||
| + | |- | ||
| + | | '''device''' | ||
| + | | SPICE | ||
| + | | <center> N </center> | ||
| + | | <center> NAME+VALUE </center> | ||
| + | |- | ||
| + | | '''refdes''' | ||
| + | | A? | ||
| + | | <center> Y </center> | ||
| + | | <center> NAME </center> | ||
| + | |- | ||
| + | | '''value''' | ||
| + | | PLOT_4Y | ||
| + | | <center> N </center> | ||
| + | | <center> NAME+VALUE </center> | ||
| + | |- | ||
| + | | '''title''' | ||
| + | | Scope plot | ||
| + | | <center> Y </center> | ||
| + | | <center> NAME </center> | ||
| + | |- | ||
| + | | '''xLabel''' | ||
| + | | xValue | ||
| + | | <center> N </center> | ||
| + | | <center> NAME+VALUE </center> | ||
| + | |- | ||
| + | | '''yLabel''' | ||
| + | | xValue | ||
| + | | <center> N </center> | ||
| + | | <center> NAME+VALUE </center> | ||
| + | |- | ||
| + | | '''color''' | ||
| + | | Y | ||
| + | | <center> N </center> | ||
| + | | <center> NAME+VALUE </center> | ||
| + | |- | ||
| + | | '''description''' | ||
| + | | XSPICE XY Parametric plot | ||
| + | | <center> N </center> | ||
| + | | <center> NAME+VALUE </center> | ||
| + | |- | ||
| + | | '''xScale''' | ||
| + | | ms | ||
| + | | <center> N </center> | ||
| + | | <center> NAME+VALUE </center> | ||
| + | |- | ||
| + | | '''yScale''' | ||
| + | | V | ||
| + | | <center> N </center> | ||
| + | | <center> NAME+VALUE </center> | ||
| + | |- | ||
| + | |} | ||
| + | |||
| + | |||
| + | '''Odkazy a literatúra''' | ||
| + | <references/> | ||
Verzia zo dňa a času 14:01, 21. marec 2010
|
|
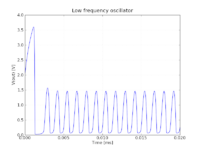
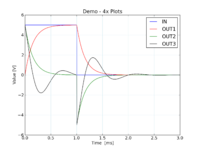
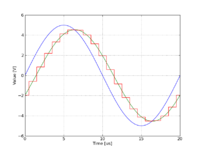
Example

|

|

|
Summary
Summary
| Name | SPICE/XSPICE 4 Channel Scope Plot |
| Device | SPICE |
| Value | PLOT_4Y |
| File | |
| Function | Graf 4 časových priebehov |
| Version | 0.1/A |
Attribute list
| Name | Value | Visible | Show |
|---|---|---|---|
| device | SPICE | ||
| refdes | A? | ||
| value | PLOT_4Y | ||
| title | Scope plot | ||
| xLabel | xValue | ||
| yLabel | xValue | ||
| color | Y | ||
| description | XSPICE XY Parametric plot | ||
| xScale | ms | ||
| yScale | V |
Odkazy a literatúra
